
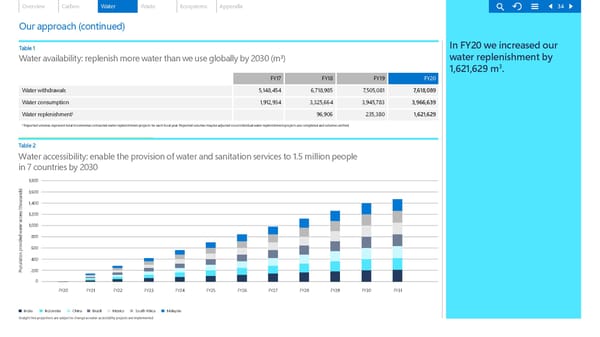
Overview Carbon Water Waste Ecosystems Appendix 34 Our approach (continued) Table 1 In FY20 we increased our Water availability: replenish more water than we use globally by 2030 (m³) water replenishment by 3 1,621,629 m . FY17 FY18 FY19 FY20 Water withdrawals 5,148,454 6,718,985 7,505,081 7,618,089 Water consumption 1,912,934 3,325,664 3,945,783 3,966,639 Water replenishment¹ 96,906 235,380 1,621,629 ¹ Reported volumes represent total incremental contracted water replenishment projects for each fiscal year. Reported volumes may be adjusted once individual water replenishment projects are completed and volumes verified. Table 2 Water accessibility: enable the provision of water and sanitation services to 1.5 million people in 7 countries by 2030 1,800 1,600 1,400 1,200 1,000 800 600 400 Population provided water access (thousands)200 0 FY20 FY21 FY22 FY23 FY24 FY25 FY26 FY27 FY28 FY29 FY30 FY31 India Indonesia China Brazil Mexico South Africa Malaysia Straight line projections are subject to change as water accessibility projects are implemented.
 Microsoft Environmental Sustainability Report 2020 Page 33 Page 35