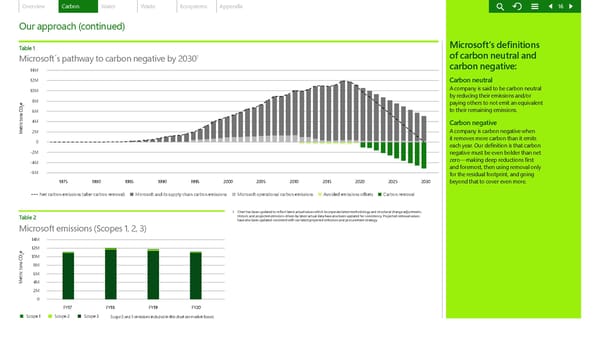
Overview Carbon Water Waste Ecosystems Appendix 16 Our approach (continued) Table 1 Microsoft’s definitions Table 1 1 of carbon neutral and Microsoft´s pathway to carbon negative by 2030 carbon negative: 14M 12M Carbon neutral 10M A company is said to be carbon neutral by reducing their emissions and/or e 8M paying others to not emit an equivalent 2 6M to their remaining emissions. 4M Carbon negative Metric tons CO2M A company is carbon negative when 0 it removes more carbon than it emits each year. Our definition is that carbon -2M negative must be even bolder than net -4M zero—making deep reductions first and foremost, then using removal only -6M for the residual footprint, and going 1975 1980 1985 1990 1995 2000 2005 2010 2015 2020 2025 2030 beyond that to cover even more. Net carbon emissions (after carbon removal) Microsoft and its supply chain carbon emissions Microsoft operational carbon emissions Avoided emissions offsets Carbon removal 1 Chart has been updated to reflect latest actual values which incorporate latest methodology and structural change adjustments. Table 2 Historic and projected emissions driven by latest actual data have also been updated for consistency. Projected removal values have also been updated consistent with our latest projected emissions and procurement strategy. Microsoft emissions (Scopes 1, 2, 3) 14M e 12M 2 10M 8M 6M Metric tons CO4M 2M 0 FY17 FY18 FY19 FY20 Scope 1 Scope 2 Scope 3 Scope 2 and 3 emissions included in this chart are market-based.
 Microsoft Environmental Sustainability Report 2020 Page 15 Page 17