
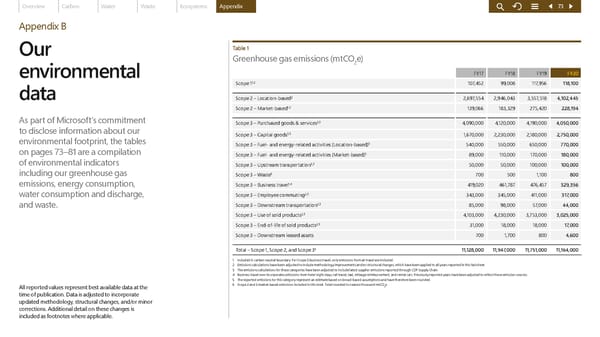
Overview Carbon Water Waste Ecosystems Appendix 73 Appendix B Our Table 1 Greenhouse gas emissions (mtCO e) 2 environmental FY17 FY18 FY19 FY20 1,2 107,452 99,008 117,956 118,100 Scope 1 data Scope 2 – Location-based² 2,697,554 2,946,043 3,557,518 4,102,445 1,2 139,066 183,329 275,420 228,194 Scope 2 – Market-based As part of Microsoft’s commitment Scope 3 – Purchased goods & services3,5 4,090,000 4,120,000 4,190,000 4,050,000 to disclose information about our Scope 3 – Capital goods3,5 1,670,000 2,230,000 2,180,000 2,750,000 environmental footprint, the tables 5 Scope 3 – Fuel- and energy-related activities (Location-based) 540,000 550,000 650,000 770,000 on pages 73–81 are a compilation 5 Scope 3 – Fuel- and energy-related activities (Market-based) 89,000 110,000 170,000 180,000 of environmental indicators 3,5 50,000 50,000 100,000 100,000 Scope 3 – Upstream transportation including our greenhouse gas 5 700 500 1,100 800 Scope 3 – Waste emissions, energy consumption, 1,4 419,020 461,787 476,457 329,356 Scope 3 – Business travel 2,5 water consumption and discharge, Scope 3 – Employee commuting 343,000 345,000 411,000 317,000 2,5 and waste. Scope 3 – Downstream transportation 85,000 98,000 57,000 44,000 Scope 3 – Use of sold products2,5 4,103,000 4,230,000 3,753,000 3,025,000 Scope 3 – End-of-life of sold products2,5 31,000 18,000 18,000 17,000 Scope 3 – Downstream leased assets 700 1,700 800 4,600 6 11,128,000 11,947,000 11,751,000 11,164,000 Total – Scope 1, Scope 2, and Scope 3 1 Included in carbon neutral boundary. For Scope 3 business travel, only emissions from air travel are included. 2 Emissions calculations have been adjusted to include methodology improvements and/or structural changes, which have been applied to all years reported in this factsheet. 3 The emissions calculations for these categories have been adjusted to include latest supplier emissions reported through CDP Supply Chain. 4 Business travel now incorporates emissions from hotel night stays, rail travel, taxi, mileage reimbursement, and rental cars. Previously reported years have been adjusted to reflect these emission sources. 5 The reported emissions for this category represent an estimate based on broad-based assumptions and have therefore been rounded. 6 Scope 2 and 3 market-based emissions included in this total. Total rounded to nearest thousand mtCO e. All reported values represent best available data at the 2 time of publication. Data is adjusted to incorporate updated methodology, structural changes, and/or minor corrections. Additional detail on these changes is included as footnotes where applicable.
 Microsoft Environmental Sustainability Report 2020 Page 72 Page 74