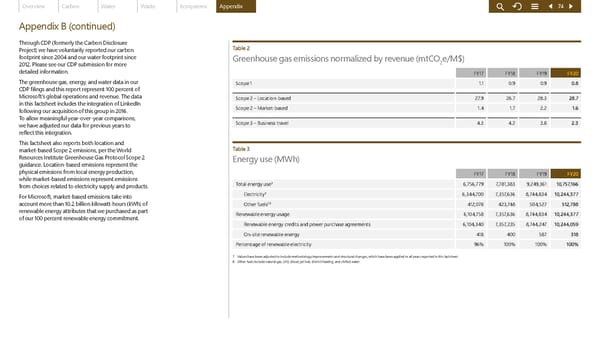
Overview Carbon Water Waste Ecosystems Appendix 74 Appendix B (continued) Through CDP (formerly the Carbon Disclosure Table 2 Project) we have voluntarily reported our carbon footprint since 2004 and our water footprint since Greenhouse gas emissions normalized by revenue (mtCO e/M$) 2012. Please see our CDP submission for more 2 detailed information. FY17 FY18 FY19 FY20 The greenhouse gas, energy, and water data in our Scope 1 1.1 0.9 0.9 0.8 CDP filings and this report represent 100 percent of Microsoft’s global operations and revenue. The data Scope 2 – Location-based 27.9 26.7 28.3 28.7 in this factsheet includes the integration of LinkedIn Scope 2 – Market-based 1.4 1.7 2.2 1.6 following our acquisition of this group in 2016. To allow meaningful year-over-year comparisons, Scope 3 – Business travel 4.3 4.2 3.8 2.3 we have adjusted our data for previous years to reflect this integration. This factsheet also reports both location and market-based Scope 2 emissions, per the World Table 3 Resources Institute Greenhouse Gas Protocol Scope 2 Energy use (MWh) guidance. Location-based emissions represent the physical emissions from local energy production, FY17 FY18 FY19 FY20 while market-based emissions represent emissions Total energy use⁷ 6,756,779 7,781,383 9,249,361 10,757,166 from choices related to electricity supply and products. For Microsoft, market-based emissions take into Electricity⁷ 6,344,700 7,357,636 8,744,834 10,244,377 account more than 10.2 billion kilowatt-hours (kWh) of 7,8 412,078 423,748 504,527 512,788 Other fuels renewable energy attributes that we purchased as part Renewable energy usage 6,104,758 7,357,636 8,744,834 10,244,377 of our 100 percent renewable energy commitment. Renewable energy credits and power purchase agreements 6,104,340 7,357,235 8,744,247 10,244,059 On-site renewable energy 418 400 587 318 Percentage of renewable electricity 96% 100% 100% 100% 7 Values have been adjusted to include methodology improvements and structural changes, which have been applied to all years reported in this factsheet. 8 Other fuels include natural gas, LPG, diesel, jet fuel, district heating, and chilled water.
 Microsoft Environmental Sustainability Report 2020 Page 73 Page 75