
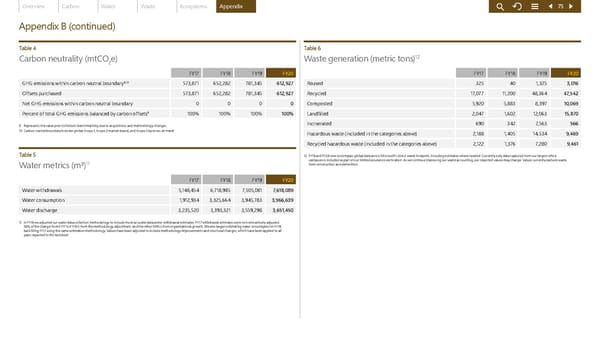
Overview Carbon Water Waste Ecosystems Appendix 75 Appendix B (continued) Table 4 Table 6 12 Carbon neutrality (mtCO e) Waste generation (metric tons) 2 FY17 FY18 FY19 FY20 FY17 FY18 FY19 FY20 GHG emissions within carbon neutral boundary9,10 573,871 652,282 781,345 612,927 Reused 325 40 1,325 3,016 Offsets purchased 573,871 652,282 781,345 612,927 Recycled 17,077 11,200 48,364 47,542 Net GHG emissions within carbon neutral boundary 0 0 0 0 Composted 5,920 5,883 8,397 10,069 Percent of total GHG emissions balanced by carbon offsets9 100% 100% 100% 100% Landfilled 2,047 1,602 12,063 15,870 9 Represents the value prior to historic benchmarking due to acquisitions and methodology changes. Incinerated 690 342 7,563 566 10 Carbon neutral boundary includes global Scope 1, Scope 2 market-based, and Scope 3 business air travel. Hazardous waste (included in the categories above) 2,188 1,405 14,534 9,469 Recycled hazardous waste (included in the categories above) 2,122 1,376 7,280 9,461 Table 5 12 FY19 and FY20 now encompass global data across Microsoft’s direct waste footprint, including estimates where needed. Currently only data captured from our largest office 11 campuses is included as part of our limited assurance verification. As we continue improving our waste accounting, our reported values may change. Values currently exclude waste Water metrics (m³) from construction and demolition. FY17 FY18 FY19 FY20 Water withdrawals 5,148,454 6,718,985 7,505,081 7,618,089 Water consumption 1,912,934 3,325,664 3,945,783 3,966,639 Water discharge 3,235,520 3,393,321 3,559,298 3,651,450 11 In FY18 we adjusted our water data collection methodology to include more accurate datacenter withdrawal estimates. FY17 withdrawal estimates were not retroactively adjusted. 50% of the change from FY17 to FY18 is from the methodology adjustment, and the other 50% is from organizational growth. We also began estimating water consumption in FY18, backfilling FY17 using the same estimation methodology. Values have been adjusted to include methodology improvements and structural changes, which have been applied to all years reported in this factsheet.
 Microsoft Environmental Sustainability Report 2020 Page 74 Page 76